Example Monitoring Setup
This section provides an example of how Canton can be run inside a connected network of Docker containers. The example also shows how you can monitor network activity. See the glossary for monitoring term definitions and the Monitoring Choices section for the reasoning behind the example monitoring setup.The Canton container image is published at
ghcr.io/digital-asset/decentralized-canton-sync/docker/canton. The example Docker Compose snippets below use ${CANTON_VERSION} as a placeholder for the tag — export CANTON_VERSION to the value for your target network before running them, or substitute it inline. See the Version Compatibility Dashboard for the current tag on MainNet, TestNet, and DevNet.Container Setup
To configure Docker Compose to spin up the Docker container network shown in the diagram, use the information below. See thecompose documentation for detailed information concerning the structure of the configuration files.
compose allows you to provide the overall configuration across multiple files. Each configuration file is described below, followed by information on how to bring them together in a running network.

Intended Use
This example is intended to demonstrate how to expose, aggregate, and observe monitoring information from Canton. It is not suitable for production without alterations. Note the following warnings:Network Configuration
In this compose file, define the network that will be used to connect all the running containers:Postgres Setup
Using only a single Postgres container, create databases for the synchronizer, along with Canton and index databases for each participant. To do this, mountpostgres-init.sql into the Postgres-initialized directory. Note that in a production environment, passwords must not be inlined inside config.
Synchronizer Setup
Run the synchronizer with the--log-profile container that writes plain text to standard out at debug level.
Participant Setup
The participant container has two files mapped into it on container creation. The.conf file provides details of the synchronizer and database locations. An HTTP metrics endpoint is exposed that returns metrics in the Prometheus Text Based Format. By default, participants do not connect to remote synchronizers, so a bootstrap script is provided to accomplish that.
Logstash
Docker containers can specify a log driver to automatically export log information from the container to an aggregating service. The example exports log information in GELF, using Logstash as the aggregation point for all GELF streams. You can use Logstash to feed many downstream logging data stores, including Elasticsearch, Loki, and Graylog.pipeline.yml to discover the locations of all pipelines.
logs- and postfixed with the date.
Elasticsearch
Elasticsearch supports running in a clustered configuration with built-in resiliency. The example runs only a single Elasticsearch node.Kibana
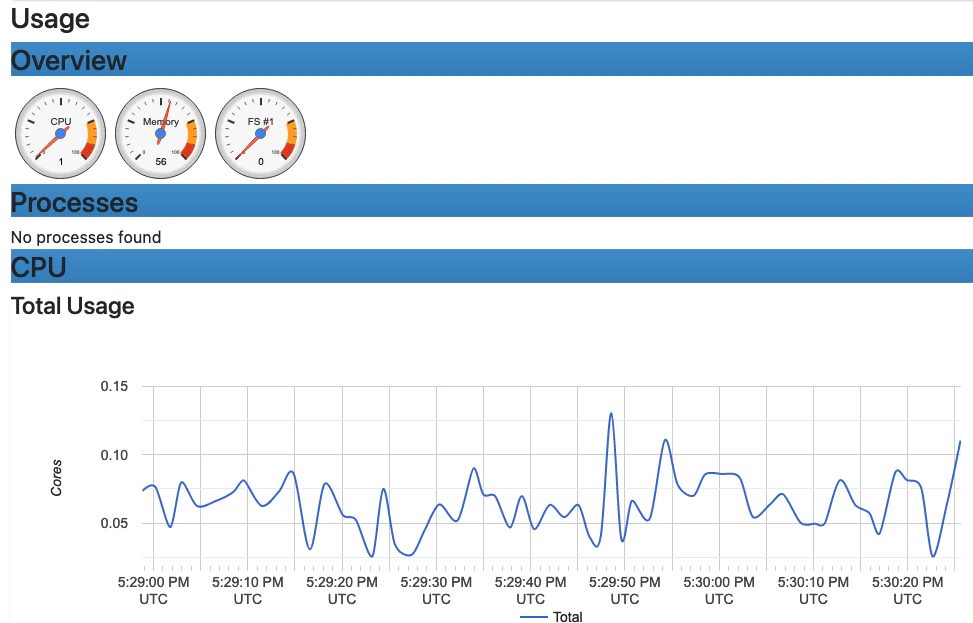
Kibana provides a UI that allows the Elasticsearch log index to be searched.cAdvisor
cAdvisor exposes container system metrics (CPU, memory, disk, and network) to Prometheus. It also provides a UI to view these metrics.You should now see a UI similar to the one shown.
- Navigate to http://localhost:8080/docker/.
- Select a Docker container of interest.
Prometheus
Configure Prometheus withprometheus.yml to provide the endpoints from which metric data should be scraped. By default, port 9090 can query the stored metric data.
Grafana
Grafana is provided with:- The connection details for the Prometheus metric store
- The username and password required to use the web UI
- The location of any externally provided dashboards
- The actual dashboards
Metric Count dashboard referenced in the docker-compose.yml file (grafana-message-count-dashboard.json) is not inlined below. The reason is that this is not hand-configured but built via the web UI and then exported. See Grafana Metric Monitoring for instructions to log into Grafana and display the dashboard.
Dependencies
There are startup dependencies between the Docker containers. For example, the synchronizer needs to be running before the participant, and the database needs to run before the synchronizer. Theyaml anchor x-logging enabled GELF container logging and is duplicated across the containers where you want to capture logging output. Note that the host address is the host machine, not a network address (on OSX).
Docker Images
The Docker images need to be pulled down before starting the network:ghcr.io/digital-asset/decentralized-canton-sync/docker/canton:${CANTON_VERSION}- docker.elastic.co/elasticsearch/elasticsearch:8.5.2
- docker.elastic.co/kibana/kibana:8.5.2
- docker.elastic.co/logstash/logstash:8.5.1
- gcr.io/cadvisor/cadvisor:v0.45.0
- grafana/grafana:9.3.1-ubuntu
- postgres:17.5-bullseye
- prom/prometheus:v2.40.6
Running Docker Compose
Since runningdocker compose with all the compose files shown above creates a long command line, a helper script dc.sh is used.
A minimum of 12GB of memory is recommended for Docker. To verify that Docker is not running short of memory, run docker stats and ensure the total MEM% is not too high.
Connecting to Nodes
To interact with the running network, a Canton console can be used with a remote configuration. For example:Remote Configurations
Getting Started
Using the previous scripts, you can follow the examples provided in the Getting Started guide.Kibana log monitoring
When Kibana is started for the first time, you must set up a data view to allow view the log data:You should now see a UI similar to the one shown here:
- Navigate to http://localhost:5601/.
- Click Explore on my own.
- From the menu select Analytics > Discover.
- Click Create data view.
- Save a data view with the following properties:
- Name:
Logs- Index pattern:
logs-\*- Timestamp field:
@timestamp
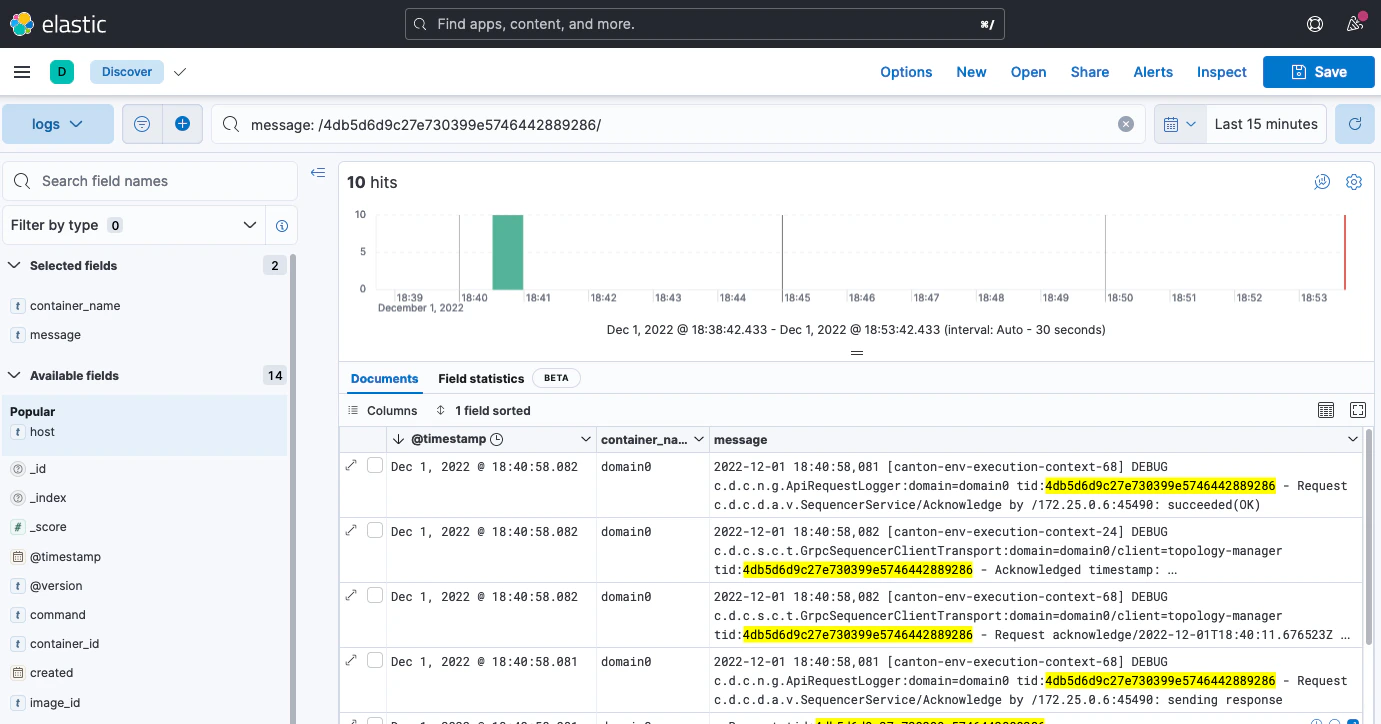
For more details, see the Kibana documentation. Note that querying based on plain text for a wide time window likely results in poor UI performance. See Logging Improvements for ideas to improve it.
- Create a view based on selected fields
- View log messages by logging timestamp
- Filter by field value
- Search for text
- Query using either
KSQLorLucenequery languages
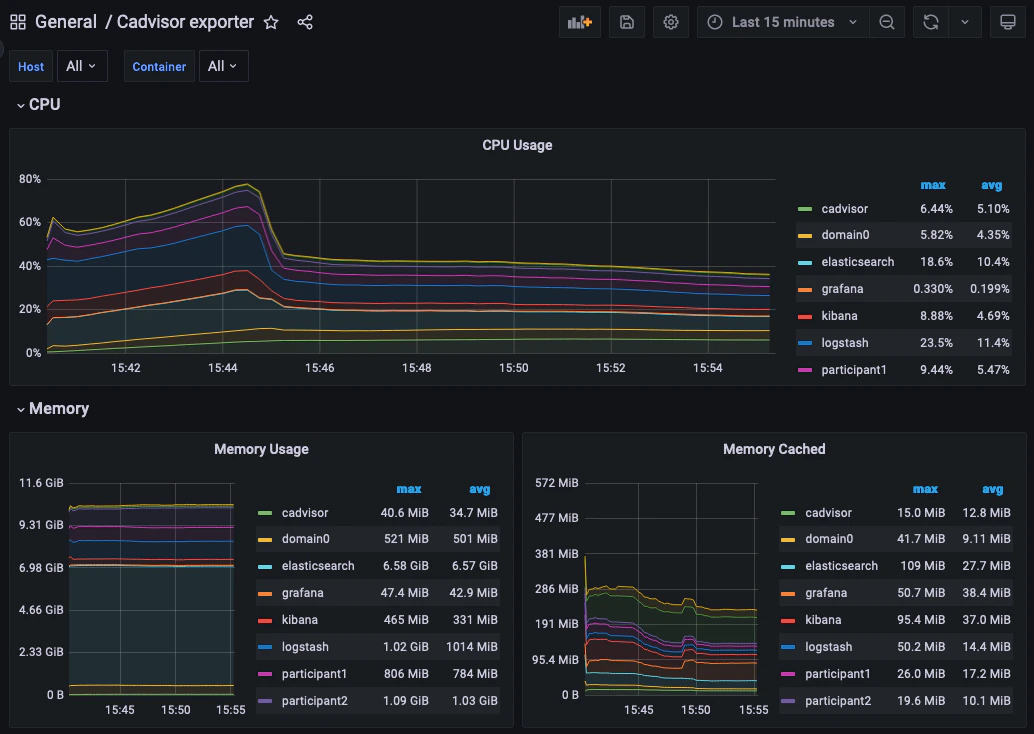
Grafana Metric Monitoring
You can log into the Grafana UI and set up a dashboard. The example imports a GrafanaLabs community dashboard that has graphs for cAdvisor metrics. The cAdvisor Export dashboard imported below has an ID of 14282.You should see a container system metrics dashboard similar to the one shown here:
- Navigate to http://localhost:3000/login.
- Enter the username/password:
grafana/grafana.- In the side border, select Dashboards and then Import.
- Enter the dashboard ID
14282and click Load.- On the screen, select Prometheus as the data source and click Import.
Monitoring Choices
This section documents the reasoning behind the technology used in the example monitoring setup.Use Docker Log Drivers
Reasons:- Most Docker containers can be configured to log all debug output to stdout.
- Containers can be run as supplied.
- No additional dockerfile layers need to be added to install and start log scrapers.
- There is no need to worry about local file naming, log rotation, and so on.
Use GELF Docker Log Driver
Reasons:- It is shipped with Docker.
- It has a decodable JSON payload.
- It does not have the size limitations of syslog.
- A UDP listener can be used to debug problems.
Use Logstash
Reasons:- It is a lightweight way to bridge the GELF output provided by the containers into Elasticsearch.
- It has a simple conceptual model (pipelines consisting of input/filter/output plugins).
- It has a large ecosystem of input/filter and output plugins.
- It externalizes the logic for mapping container logging output to a structures/ECS format.
- It can be run with
stdin/stdoutinput/output plugins for use with testing. - It can be used to feed Elasticsearch, Loki, or Graylog.
- It has support for the Elastic Common Schema (ECS) if needed.
Use Elasticsearch/Kibana
Reasons:- Using Logstash with Elasticsearch and Kibana, the ELK stack, is a mature way to set up a logging infrastructure.
- Good defaults for these products allow a basic setup to be started with almost zero configuration.
- The ELK setup acts as a good baseline as compared to other options such as Loki or Graylog.
Use Prometheus/Grafana
Reasons:- Prometheus defines and uses the OpenTelemetry reference file format.
- Exposing metrics via an HTTP endpoint allows easy direct inspection of metric values.
- The Prometheus approach of pulling metrics from the underlying system means that the running containers do not need infrastructure to store and push metric data.
- Grafana works very well with Prometheus.
Logging Improvements
This version of the example only has the logging structure provided via GELF. It is possible to improve this by:
- Extracting data from the underlying containers as a JSON stream.
- Mapping fields in this JSON data onto the ECS so that the same name is used for commonly used field values (for example, log level).
- Configuring Elasticsearch with a schema that allows certain fields to be quickly filtered (for example, log level).
Participant Node Health
The participant exposes health status information in several ways, which may be inspected manually when troubleshooting or integrated into larger monitoring and orchestration systems.Using gRPC Health Service for Load Balancing and Orchestration
The Participant Node provides agrpc.health.v1.Health service, implementing the gRPC Health Checking Protocol protocol.
Kubernetes containers can be configured to use this for readiness or liveness probes, e.g.
Ledger API.
Likewise, gRPC clients and NGinx can be configured to watch the health service for traffic management and load balancing.
You can manually check the health of a Participant with a command line tool such as grpcurl e.g. (using the Participant’s actual address):
SERVING if it is currently ready and available to serve requests.
Calling Watch will perform a streaming health check. The server will immediately send the current health of the Participant, and then send a new message whenever the health changes.
When multiple Participant replicas are configured, passive nodes return NOT_SERVING.
In practice, the health of the Participant is composed of the health of the components it depends on. You can query these individually by name, by making a request with the service field set to the name of the component. An empty or unset service field returns the aggregate health of all components. An unknown name will result in a gRPC NOT_FOUND error.
Checking health via HTTP
Health checking can also be done via HTTP, which is useful for frameworks that don’t support gRPC Health Checking Protocol. Setting monitoring.http-health-server.port= in the configuration for your node will expose health information at the URLhttp://<host>:<port>/health.
Here the important information is reported via the HTTP Reponse status code.
- A status of
200is equivalent toSERVINGfrom the gRPC Health Service. - A status of
503is equivalent toNOT_SERVING. - A status of
500means the check failed for any other reason.
Inspection of General Health Status
General information about the Participant Node, including about unhealthy synchronizers and dependencies, and whether the node is currently Active, can be displayed in the canton console by invoking thehealth.status command on the node.
ParticipantStatus call.
The canton console can also provide information about all connected nodes, including those remotely connected, by invoking the command at the top level.
Generating a Node Health Dump for Troubleshooting
When interacting with support or attempting to troubleshoot an issue, it is often necessary to capture a snapshot of relevant execution state. Canton implements a facility that gathers key system information and bundles it into a ZIP file. This will contain:- The configuration you are using, with all sensitive data stripped from it (no passwords).
- An extract of the log file. Sensitive data is not logged into log files.
- A current snapshot on Canton metrics.
- A stacktrace for each running thread.
health.dump(), which returns the path to the resulting ZIP file.
remoteParticipant1.health.dump()
When packaging large amounts of data, increase the default timeout of the dump command:
Admin API of the Participant Node via the StatusService’s HealthDump. This call streams back the bytes of the produced ZIP file.
Monitoring for Slow or Stuck Tasks
Some operations can report when they are slow, if you enable<task name> has not completed after <duration>. This feature is disabled by default to reduce the overhead.
Canton also provides a facility to periodically test whether we are able to schedule new tasks in a timely manner, enabled via the configuration
Task runner <name> is stuck or overloaded for <duration> will be emitted. This may indicate that resources such as CPU are overloaded, that the Execution Context is too small, or that too many tasks are otherwise stuck. If the issue resolves itself, a subsequent log message: Task runner <name> is just overloaded, but operating correctly. Task got executed in the meantime will be emitted.
Disabling Restart on Fatal Failures
Processes should be run under a process supervisor, such assystemd or Kubernetes, which can monitor them and restart them as needed. By default, the Participant Node process will exit in the event of a fatal failure.
If you wish to disable this behaviour
Monitor ACS Commitments
A participant that fails to send commitments in a timely manner is problematic for its counter-participants: Counter-participants cannot prune their state, because they have no proof that their state is the same as the state of the participant. More information on commitments is available in the Pruning overview section. This page describes the monitoring options for ACS commitments. Commitment monitoring supports participant node operators in several ways. First, monitoring provides insight into commitment generation performance, allowing the participant node operator to troubleshoot and fix potential performance problems. For example, monitoring metrics indicate potential performance bottlenecks, which the operator can use as input for configuring commitment generation. Second, monitoring provides insights into the status of commitments from counter-participants. This is relevant for the participant node operator because a counter-participant that runs behind in commitment generation, either because it is faulty or because the network is slow, prevents pruning on the participant: The participant does not know whether its state and the counter-participant’s state diverged, and cannot prune because it might need to investigate a potential fork. The operator can use the monitoring metrics to identify slow counter-participants and potentially blacklist them.Monitoring own commitments
We provide the following metrics for commitment generation, which are described in detail in the Metrics reference section:daml.participant.sync.commitments.compute: Measures the time that the participant node spends computing commitments.daml.participant.sync.commitments.sequencing-time: Measures the time between the end of a commitment period, and the time when the sequencer observes the corresponding commitment.daml.participant.sync.commitments.catchup-mode-enabled: Measures how many times the catch-up mode has been triggered.
Monitoring counter-participant commitments
The operator can monitor the status of commitments from the counter-participants through latency metrics. These metrics can reveal slow counter-participants, which are behind in sending commitments, and enable operators to configure thresholds defining when a counter-participant is considered slow. The operator can group counter-participants into three categories, which affect metric reporting:- Default
- Distinguished
- Individually monitored
-
Default: All counter-participants that are not distinguished or individually monitored belong to this group by default. We publish one aggregated metric for all participants in this group:
daml.participant.sync.commitments.synchronizer.largest-counter-participant-latencywhich represents the highest latency in milliseconds for commitments from counter-participants outstanding for more than a threshold number of reconciliation intervals. -
Distinguished: The operator has the option to upgrade some default counter-participants to the distinguished group, for example, counter-participants with whom it has important business relations. We produce one aggregate metric for all distinguished participants, published under
daml.participant.sync.commitments.synchronizer.largest-distinguished-counter-participant-latencyJust as for the Default group, the metric represents the highest latency in milliseconds for commitments outstanding for more than athresholdDistinguishednumber of reconciliation intervals. The following examples show how the operator ofparticipant1adds counter-participantparticipant4to the distinguished group on synchronizersynchronizer2Id, and removes counter-participantparticipant2from the distinguished group on synchronizersynchronizer1Id: -
Individually monitored: The operator can optionally select counter-participants whose commitment status it wants to monitor individually, for example because they recently presented intermittent failures and have just recovered, or because the operator observes a slowdown in one of the other groups and wants to locate the cause. Each participant gets its own unique label under daml.participant.sync.commitments.synchronizer.counter-participant-latency. Individual alerting can be set based on the business relations. (Note: any participant, whether Default or Distinguished, can be added to Individually monitored. A distinguished participant remains in the Distinguished group even if it is Individually monitored. In contrast, a Default participant that is added to Individually monitored is removed from the Default group.)
The following examples show how the operator of
participant1adds/removes counter-participantparticipant3to be Individually monitored on the synchronizersynchronizerId:
participant1 can apply a monitoring configuration to synchronizers synchronizer1Id and synchronizer2Id.